Missouri Valley Football Conference Athletic Budgets: Money Matters
Last week, I discussed airport travel times and why that offers hidden advantages (or disadvantages) amongst schools in conference. The Dakota schools in the MVFC also have some advantages over some of the other far-reaching schools in the conference (Youngstown, Indiana St., Missouri St.) as SDSU, USD, UND, and NDSU have the ability to bus to each other (UND and USD may fly to each other) and avoid some of the travel time issues previously discussed. This week, I am going to look at the athletic budgets among the MVFC schools and see where the biggest disparities are. To note, the athletic budgets discussed below include all sports, both men and women, which means that while SDSU and Northern Iowa may be in the same conference for football, in all other sports, they are in much different conferences (Summit League and Missouri Valley). That doesn’t mean that the conferences are at different ability levels in terms of “Olympic sports”, but the Missouri Valley is considered a “marquee” mid-major conference in men’s basketball while the Summit is a relative afterthought. Consider this when examining the athletic budgets below.
Also note that the 2019 athletic budgets were used for this article, as the 2020 budgets were extremely effected by COVID and did not present as clear of picture as 2019 did.
MVFC athletic budgets for the fiscal year 2019
1. University of North Dakota - $30.5 million
2. Illinois State University - $29 million
3. Missouri State University - $28.76 million
4. North Dakota State University - $27.25 million
5. South Dakota State University - $23.4 million
6. Southern Illinois University - $22.5 million
7. Northern Iowa University- $20.49 million
8. University of South Dakota - $19.9 million
9. Indiana State University - $ 17.4 million
10. Youngstown State University - $16.2 million
11. Western Illinois University - $ 10.59 million
Data via http://cafidatabase.knightcommission.org/fcs
Per usual, SDSU is mid-pack when in comparison to the rest of the conference and just behind NDSU. UND surprisingly tops the list, but on deeper examination, should be of no surprise. In 2017, the school cut men’s and women’s swimming and diving as well as women’s hockey. The school also moved from the Big Sky to the Summit, swapping flights to Sacramento for bus trips to Brookings. UND also has something that no other program in the MVFC has: a highly successful men’s hockey team, capable of winning national championships and bringing both revenue and eye-balls to the university. Men’s hockey is not cheap however and its sponsorship at UND is a big reason why they top the athletic budget list here.
Illinois State is second on the list and while their number (29 million is high) the explanation is rather simple. Illinois State’s out of state tuition is approximately $26,000. Compare that to SDSU’s (which is approximately $12,000) and it becomes clear where Illinois State spends their money. In 2019, Illinois St. had 101 football players on its roster. At the FCS level, 63 full scholarships are available for football and unlike other sports, football usually gives out “fulls or nothing” which means 63 players take up 63 of the scholarships. Out-of-state players made up approximately 50% of the roster. While not all out-of-state players received a scholarship, it can be assumed a good majority did which means Illinois St. is spending a lot of its budget on athletic scholarships, primarily for football but other sports (such as men’s and women’s basketball) as well. So while Illinois St.’s budget is nearly 30 million, that number can be misleading, especially when you compare it to SDSU’s.
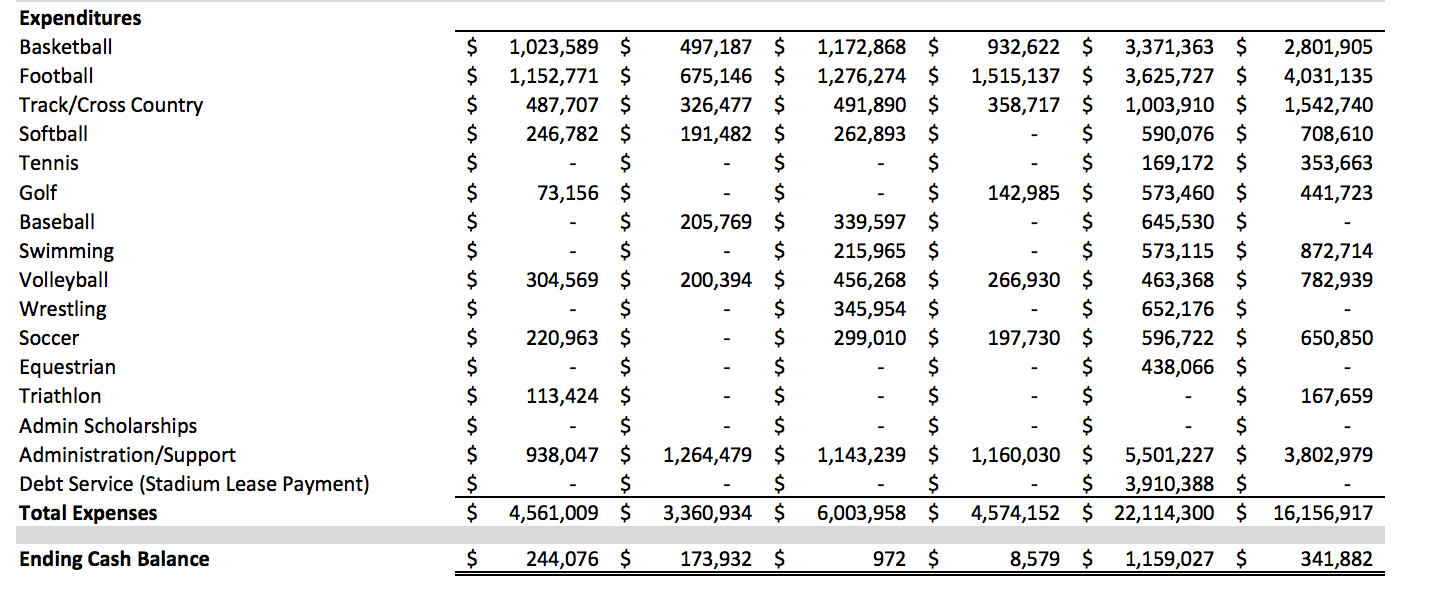
Below is a breakdown for the FY 19 athletic spending from the South Dakota Board of Regents:
SDSU spent $3.6 million on football compared to USD’s $4 million. Despite USD spending nearly half a million more, they went 5-7 (but did manage to beat SDSU in the Dakota Dump). Some of the biggest differences between SDSU and USD budgets are the sports where the two schools choose to spend. USD only has six men’s sports vs. SDSU’s eight, similarly in women’s sports, USD does not sponsor equestrian, while SDSU does and spends significant money on it each year. The biggest takeaway here is: USD has less sports but spends more on the ones they do have. SDSU has more sports but spends less on each. Either way is viable, this is more of a personal choice done by the respective leaderships and the vision that they have for the athletic programs.
In a broader sense, the athletic budgets presented give us a better idea (outside of specific team attributes) why some schools experience more success in athletics than others. SDSU and NDSU are consistently towards the top of the Summit League in all sports outside of football. They are also consistently making the FCS playoffs and battling for the MVFC title. Comparatively, Western Illinois is a consistent bottom-dweller in most sports, including football. Why? They spend $10.5 million on athletics, a whopping $17 million less than NDSU. Western Illinois lack of success should come as no surprise, because in college athletics, money matters.


